Garneill's Livability
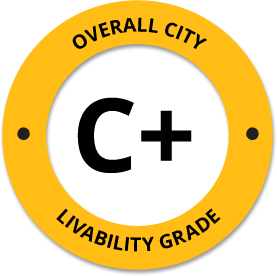
-
B+
Affordability -
F
Housing -
B
Job Market -
A-
Diversity -
A-
Crime -
A-
Commute -
C-
Education -
C-
Weather -
F
Amenities
About Garneill, MT
Garneill, MT is located in Fergus County in the state of Montana.
The total City Population for Garneill is about 362 with about 2 people per square mile.
The Average Home Value is $115,600, which is roughly 46% lower than the Average Home Value of $215,648 for the state of Montana, and roughly 47% lower than the National Average of $217,072.
The Median Income Per Household is about $39,500, which is roughly 25% lower than the Average Median Income Per Household of $52,517 for the state of Montana, and roughly 39% lower higher than the National Average of $65,026.


Quick Stats
Demographic Details
Average # of People Per Household: 2.26Male Population Estimate: 53.9%
Female Population Estimate: 46.1%
Median Age: 51.5
Male Median Age: 49.9
Female Median Age: 53.1
Racial Demographic Estimates
Asian:2.5%
Indian:1.7%
Black:0.6%
Hispanic:0.3%
Hawaiian:0%
Other:0%
Voting


Voting Results by Party
Democratic: 22.99%
Libertarian: 2.18%
Crime Details
NOTE: Crime is available at the County level so this doesn't necessarily represent the city of Garneill specifically.
Average # of Homicides for Fergus County: About 0 per 100,000 People
(last recorded in 0)
Average # of Violent Crimes for Fergus County: About 236.183 per 100,000 People
(last recorded in 2021)
Fergus County is about 100% lower than the national average of about 4 homicides per 100,000 people, and about 18% lower than the national average of about 288 violent crimes per 100,000 people.
Employment
Montana is ranked #27 out of 52 for Best and Worst States to Work in America, with an overall score of 43.99 out of 100.

Wage Policies
Overall Wage Policy Score: 49.56The average living wage for the state of Montana is $31.55/hr, while the states minimum wage is $8.75/hr, which can be set above the state standard, and is extended to farm workers. This gives Montana a minimum wage score of 30.57 compared to all other states.
The minimum wage for tipped employees is $8.75/hr, which gives Montana a minimum wage for tipped employees score of 100 compared to all other states.
The weekly unemployment (UI) benefit for Montana is $182.00, resulting in a UI benefit score of 27.41 compared to all other states.
Worker Protection Policies
Overall Worker Protection Score: 71.43X Montana does offer protections for workplace breastfeeding.
✓ Montana does mandate equal pay across gender and race.
X Montana does prohibit pay secrecy practices in the workplace.
X Montana does restrict access to salary history to reduce gender and racial bias.
X Montana does provide some form of paid family leave.
X Montana does provide some form of paid sick leave.
X Montana does not provide flexible scheduling of worker shifts.
X Montana does not mandate pay reporting or "call-in" pay by employers.
X Montana does not provide split shift pay regulation.
X Montana does not provide workers advanced notice of shift scheduling.
✓ Montana does provide some form of sexual harassment protection in state law.
✓ Montana does extend workers compensation mandates to farmworkers.
X Montana does not extend worker protections to domestic workers.
Right To Organize Policies
Overall Right To Organize Score: 70X Montana does legalize project labor agreements to ensure a fair wage to workers on contract.
X Montana does not protect workers against wage theft retaliation.
✓ Montana does partially require collective bargaining for public workers.
✓ Montana does provide collective bargaining for teachers.
✓ Montana does provide wage negotiations for teachers.
A global organization that fights inequality to end poverty and injustice.
Nearby Location
- Judith Gap, MT ( 5.07 mi. )
- Buffalo, MT ( 5.94 mi. )
- Straw, MT ( 7.23 mi. )
- Moore, MT ( 15.60 mi. )
- Hobson, MT ( 17.96 mi. )
- Two Dot, MT ( 21.82 mi. )
- Moccasin, MT ( 21.99 mi. )
- Harlowton, MT ( 22.15 mi. )
- Lewistown, MT ( 25.03 mi. )
- Benchland, MT ( 25.81 mi. )
- Heath, MT ( 28.42 mi. )
- Windham, MT ( 28.93 mi. )
- Shawmut, MT ( 30.38 mi. )
- Forest Grove, MT ( 32.56 mi. )
- Martinsdale, MT ( 33.56 mi. )
- Stanford, MT ( 35.27 mi. )
- Ryegate, MT ( 39.30 mi. )
- Hilger, MT ( 39.42 mi. )
- Denton, MT ( 40.40 mi. )
- Coffee Creek, MT ( 44.01 mi. )
- Lennep, MT ( 44.13 mi. )
- Melville, MT ( 45.86 mi. )
- Cushman, MT ( 46.53 mi. )
- Neihart, MT ( 48.12 mi. )
- Grass Range, MT ( 48.63 mi. )
- Geyser, MT ( 49.58 mi. )
- Lavina, MT ( 49.93 mi. )
Additional Location Details
Zip Code(s): 59453Latitude: 46.752500
Longitude: -109.752700
TimeZone: Mountain (GMT -07:00)
Daylight Saving: Yes
Region: West
Average Elevation: 4544.0 ft.
Area Code(s): 406